Syllabus Edition

First teaching 2023

First exams 2025

|

Transport (HL IB Biology)

Topic Questions

5 hours77 questions
1a
Sme Calculator
3 marks

The following diagram shows the internal structure of the heart.7Lyl7pVl_e-1a

A and C represents two heart chambers.

(i)
Label chambers A and C.

[2]

(ii)

State one difference in the function of A and C.

[1]

1b
Sme Calculator
1 mark

State the main difference between the blood found in the chambers on the left and right side of the heart.

1c
Sme Calculator
2 marks

Structure B plays an important role in the flow of blood through the heart.

(i)

Label structure B.

[1]

(ii)

State the role of structure B in the flow of blood through the heart.

[1]

1d
Sme Calculator
1 mark

Structure D is a wall of muscular tissue.

Describe the purpose of structure D in the heart.

Did this page help you?

2a
Sme Calculator
2 marks

The following diagram compares the structure of two main blood vessels in the body.

6-2-easy-q2a

(i)

Identify blood vessel A.

[1]

(ii)

State a reason for your answer in part i).

[1]

2b
Sme Calculator
2 marks

Blood vessel B has a very large lumen.

(i)

Identify blood vessel B.

[1]

(ii)

State one reason for the presence of a large lumen in blood vessel B.

[1]

2c
Sme Calculator
2 marks

The flow of blood in veins is not assisted by the pressure generated by the beating of the heart.

List two structures that assist with the flow of blood in veins.

2d
Sme Calculator
1 mark

Systolic pressure is one of the measurements taken by a doctor to determine the blood pressure of a patient.

Define the term 'systolic pressure'.

Did this page help you?

3a
Sme Calculator
2 marks

The following diagram shows part of the blood circulation of a mammal.

SKefWwjT_e-3a

(i)

Identify one example of an artery in this diagram. 

[1]

(ii)

Based on the information in the diagram, state a reason for your answer in part i).

[1]

3b
Sme Calculator
1 mark

Mammals have two separate circulations that supply blood to different organs.

State the name of the circulation that blood vessels T and S form part of.

3c
Sme Calculator
2 marks

The following table shows the mean pressure (in mmHg) measured in different blood vessels of the body.

Blood vessel Mean blood pressure / mmHg
Aorta 94
Arteries 90
Arterioles 68
Capillaries 24
Venules 10
Veins 3
Vena Cava 2

Calculate the percentage difference between the mean blood pressure of the aorta and vena cava. Show your working and give your answer to three significant figures.

3d
Sme Calculator
1 mark

Using the table provided, identify the blood vessels where the greatest decrease in mean blood pressure occurs.

Did this page help you?

4a
Sme Calculator
1 mark

The following diagram compares the structure of an artery of a healthy person with that of someone suffering from atherosclerosis.

6-2-easy-q4a

Identify structure X.

4b
Sme Calculator
1 mark

Atherosclerosis can lead to the occlusion of arteries over time.

Define the term 'occlusion'.

4c
Sme Calculator
2 marks

Occlusion of the arteries can have a serious impact on cardiovascular health.

List two consequences of an occlusion of the arteries.

4d
Sme Calculator
1 mark

When blood flow to part of the heart muscle is restricted due to blockages in the coronary arteries, it will impair its ability to contract fully. This will reduce blood flow, and therefore oxygen flow, to the body tissues.

State one treatment option available to patients with blockages in their coronary arteries.

Did this page help you?

5a
Sme Calculator
3 marks

Capillaries provide the exchange surface in the tissues of the body.

List three characteristics of capillaries.

5b
Sme Calculator
6 marks

Describe the flow of oxygenated blood through the left side of the heart as it returns from the lungs.

Did this page help you?

6a
Sme Calculator
1 mark

The image shows the cross section of a leaf.

7-2-fig-2-1Identify the substance which is represented by the arrows in the diagram.

6b
Sme Calculator
3 marks

Draw three lines to correctly identify the method of particle movement shown in the diagram from part a).

4~MdS3aW_transport-mechanism-sq
6c
Sme Calculator
2 marks
(i)

Identify the letters from the diagram in part a) that represents the xylem.

[1]

(ii)

Describe one adaptation of the xylem which makes it suitable for its function.

[1]

6d
Sme Calculator
1 mark

The diagram below represents a plant organ.

iiQrQbZs_xylem-in-the-root-sq

State the name of this organ.

Did this page help you?

7a
Sme Calculator
1 mark

The transpiration stream relies on cohesion to maintain a continuous column of water in the xylem.

Define the meaning of the term 'cohesion'.

7b
Sme Calculator
1 mark

Capillarity is a term used to describe the movement of water through narrow diameter tubing, called capillary tubing, against the force of gravity. This phenomenon is represented by the image in the diagram.

capilarity-and-adhesion-sq

In combination with the cohesion described at part a), identify one other property of water which allows transport through the capillary tube.

Did this page help you?

8a
Sme Calculator
2 marks

Movement of water into the root occurs by osmosis.

Describe the process used by plant roots to ensure the water potential of the root cells is lower than the surrounding soil.

8b
Sme Calculator
1 mark

Some plants develop mutualistic relationships with soil fungi.

Identify the key benefit to the fungus of this relationship with the plant.

Did this page help you?

9a
Sme Calculator
4 marks

Draw a labelled diagram of the vascular system seen in the cross section of a plant stem.

9b
Sme Calculator
5 marks

Describe the route of water as it moves through a plant in the transpiration stream.

Did this page help you?

10a
Sme Calculator
3 marks

The statements A - F below are incorrectly ordered. 

7mgieike-translocation-events-sort---sq

Identify the correct chronological order of statements A - F

10b
Sme Calculator
2 marks

When sucrose reaches its sink, it is converted to an oligosaccharide. 

Describe the possible structure of an oligosaccharide.

10c
Sme Calculator
3 marks

Once water in the translocation stream reaches a sink, such as a root tuber, changes in water potential cause the water to take a different path.

State what that path is and the eventual destination of the water molecules. 

Did this page help you?

11a
Sme Calculator
2 marks

Name the two main assimilates (products of plants' metabolism) that are carried in the phloem. 

11b
Sme Calculator
2 marks

Define the term 'source' when used in the context of plant biology. 

11c
Sme Calculator
1 mark

The image shows a wild banana, cut lengthways. Inside the banana, its seeds are clearly visible. Seeds are usually regarded as sinks. 

Give an example of when seeds such as these act as a source. 

banana-with-seeds-1

Did this page help you?

12a
Sme Calculator
1 mark

Plasmodesmata found in phloem cells tend to have a wider diameter than those found in cells of the xylem. 

Suggest a reason for this.

12b
Sme Calculator
2 marks

Phloem sieve tubes are adapted to minimise the frictional resistance to the flow of fluid within them.

List two ways by which friction is minimised within a phloem sieve tube. 

12c
Sme Calculator
2 marks

A traditional practice used in forestry to manage tree growth is called girdling. This involves removing a complete ring of bark, as shown in the image below. The tree dies over a period of time, allowing forests to be thinned out as required. 

92cjzMKs_girdling---sq

State how girdling may kill a tree over time. 

12d
Sme Calculator
2 marks

State the role of the parenchyma in phloem tissue. 

Did this page help you?

13a
Sme Calculator
6 marks

Phloem sieve tubes, similar to many other specialised cells, have features that allow them to carry out their function. Some of these are listed in the table below:

Feature How the feature assists the function of phloem 
Elements lined up end-to-end  
  Aids loading/unloading of assimilates and contains nucleus
  Possess functional membranes for active transport, osmosis etc
  To allow room for flow without obstruction/resistance etc
Rigid cellulose cell walls  
  To release energy for active transport into / out of the phloem sieve tube

Outline these features and how they assist the function of phloem by completing the missing information in the table above. 

13b
Sme Calculator
5 marks

List five contrasts between xylem and phloem vessels. 

Did this page help you?

1a3 marks

The graph below shows the data obtained by scientists investigating the effect of omega-3 fatty acid consumption on the relative risk of coronary heart disease in humans.

Figure 1

 q4c-2-2-carbohydrates-lipids-medium-ib-hl-biology-sq

Using the data in the graph, evaluate whether coronary heart disease can be prevented by increasing omega-3 intake.

1b
Sme Calculator
2 marks

Using the graph in part (a), deduce the approximate daily mass of omega-3 required to reduce the risk of coronary heart disease by 40%

Did this page help you?

2a
Sme Calculator
2 marks

The diagram below shows part of the blood circulation in a mammal.

v84gn54O_screenshot-2023-07-12-at-10-21-39-pm

Identify the letter that represents each of the following blood vessels

Pulmonary vein 

square

Pulmonary artery     

begin mathsize 48px style square end style

2b
Sme Calculator
2 marks

Explain the function of the coronary arteries.           

2c
Sme Calculator
2 marks

The human circulatory system is a closed, double circulatory system.

Explain what is meant by this.

2d
Sme Calculator
2 marks

Babies can sometimes be born with a small hole between the right and left ventricles of their heart.

Suggest why these babies often have problems supplying their tissues with enough oxygen.

Did this page help you?

3a
Sme Calculator
1 mark

The graph below below shows changes in pressure in parts of a human heart during one second. screenshot-2023-07-13-at-6-10-31-am

Identify the time at which the semilunar valves open.

3b
Sme Calculator
1 mark

Use the graph from part (a) to calculate the heart rate in beats per minute (bpm)

3c
Sme Calculator
2 marks

Valves are important structures found in the heart and veins.

Explain how valves work.

3d
Sme Calculator
3 marks

Ventricular systole causes an increase in pressure in the aorta shown at around 0.16 seconds in part (a)

Explain why this increase in aortic pressure is important for the organism.

Did this page help you?

4a
Sme Calculator
1 mark

The graph below shows the rate of blood flow in various blood vessels in the body. It also shows the total cross-sectional area of the vessels.

YPP-3p1w_screenshot-2023-07-13-at-6-21-47-am

Suggest why the rate of blood flow increases from the venules to the vena cava despite a large decrease in the total cross-sectional area.                                                               

4b
Sme Calculator
2 marks

The relative thickness of layers in the wall of an artery and a vein are shown in the table below.

Layer in wall Thickness / µm
Artery Vein
Endothelium 25 25
Smooth muscle 495 245
Elastic tissue 375 245
Connective tissue 125 125


Explain the difference in the thickness of elastic tissue for the artery versus the vein.

4c
Sme Calculator
2 marks

The external diameter of a vein was measured at 1.5 mm. 

Calculate the diameter of the lumen of the vein.

4d
Sme Calculator
3 marks

Explain how the structure of capillaries enable them to function efficiently as exchange surfaces.

Did this page help you?

5a
Sme Calculator
2 marks

Plant sterols and plant stanols are found in a range of food, including vegetables,  cereals, seeds and nuts. Plant sterols and stanols have a similar structure to cholesterol and reduce the absorption of cholesterol in the small intestine, so more cholesterol is lost in the faeces. This helps to lower the levels of cholesterol in the blood and in turn, reduce the risk of coronary heart disease (CHD).

A group of scientists wanted to investigate the effects of eating plant sterols and stanols on the risk of CHD. The scientists randomly divided healthy volunteers into two groups. Every day for eight weeks, one group was given plant sterols and stanols to eat. The other group acted as a control.

Each week, the scientists measured the diameter of the lumen of the main artery in the arm of the volunteers.

State how the control group should have been treated.

5b
Sme Calculator
3 marks

The results of the experiment in part (a) are shown in the table below.

  Mean maximum diameter of lumen of main artery in the arm (mm)

Experimental group

(± standard deviation)

Control group

(± standard deviation)

Before experiment 0.69 (± 0.02) 0.71 (± 0.02)
After 8 weeks 0.74 (± 0.03) 0.72 (± 0.05)


A student reading the results concluded that there was sufficient evidence to assume a causal relationship between plant sterols and stanols, and a reduced risk of CHD.

Evaluate the student’s conclusion.

5c
Sme Calculator
2 marks

An electrocardiogram (ECG) measures the electrical fluctuation within a cardiac muscle as a heart is beating. The diagram below shows an ECG trace for a normal, healthy person and an ECG trace for a person suffering from heart disease.

Figure 1-poqm_qH_ma4c-6-2-the-blood-system-medium-ib-hl-biology-sq

Describe the path that electrical impulses follow when they are transmitted from the sinoatrial node to cause contraction in the ventricular muscle in a healthy heart.

5d
Sme Calculator
2 marks

Suggest how the information from part (c) shows that the damage caused to the diseased heart is likely to have affected the sinoatrial node (SAN).

Did this page help you?

6a
Sme Calculator
6 marks

Explain what causes the heart rate to increase during exercise.

6b
Sme Calculator
4 marks

Describe how blood returns to the heart from the legs.

Did this page help you?

7a
Sme Calculator
2 marks

The diagram below shows a transverse section (TS) of a plant stem.

q3a_9-1_transport_in_the_xylem_of_plants_medium_ib_hl_biology_sq

Identify the structure found at J and state its function.

7b
Sme Calculator
3 marks

In xylem vessels, hydrogen bonds form between polar water molecules.

Describe the role that hydrogen bonding plays in the cohesion-tension theory of water transport in the xylem of plants.

Did this page help you?

8a
Sme Calculator
2 marks

Explain a property of water that allows it to flow as mass transport in the transpiration stream. 

8b
Sme Calculator
4 marks

Explain how a plant replaces the water it loses via transpiration.

Did this page help you?

9
Sme Calculator
4 marks

Angiosperms (commonly known as flowering plants) are a group of plants that have vascular tissue, whereas bryophytes (mosses, liverworts and hornworts) are a group of plants that lack vascular tissue.

Suggest some advantages of possessing vascular tissue.

Did this page help you?

10a
Sme Calculator
2 marks

The diagram below shows a longitudinal section (LS) of phloem tissue in a plant. Cell type B is characterised by a large number of mitochondria.q1a_9-2_transport_in_the_phloem_of_plants_medium_ib_hl_biology_sq

Suggest why this is advantageous.

10b
Sme Calculator
2 marks

Using the diagram in part a), suggest and explain a way in which the intracellular spaces of the sieve cells are adapted for mass transport.

10c
Sme Calculator
2 marks

Suggest and explain a way in which the cell walls of sieve cells are adapted for mass transport.

10d
Sme Calculator
1 mark

Most of the sugars produced by plants are used up rapidly in respiration. However, sometimes plants can overproduce sugars during photosynthesis. 

Describe what happens to excess sugars in plants

Did this page help you?

11a
Sme Calculator
2 marks

The diagram below shows a transverse section (TS) of a plant stem.

q2a_9-2_transport_in_the_phloem_of_plants_medium_ib_hl_biology_sq

Identify the structure found at I and state its function.

11b
Sme Calculator
3 marks

A scientist used radioactive carbon dioxide to investigate the direction and rate of sucrose transport in a plant. Their results showed that during periods of plant growth, sucrose was mainly transported upwards.

Explain why this occurs.

11c
Sme Calculator
2 marks

Although most of the sugars produced by plants are used up rapidly in respiration, plants can sometimes overproduce sugars during photosynthesis. Excess sucrose in sink tissues can be converted to starch.

Suggest the benefits of this for maintaining translocation in the plant.

Did this page help you?

12a
Sme Calculator
3 marks

Translocation occurs from regions known as ‘sources’ to regions known as ‘sinks’.

Describe what the term ‘sink’ refers to and state two examples of ‘sinks’.

12b
Sme Calculator
3 marks

Plasmodesmata are present in the cell walls of companion cells.

Explain what these plasmodesmata are and their function in companion cells.

12c
Sme Calculator
3 marks

Referring to the movement of sucrose in your answer, explain how a high hydrostatic pressure is generated at ‘source’ sites in plants.

Did this page help you?

13a
Sme Calculator
5 marks

Describe how sugar is transported from the lower leaves of a plant to the growing leaf buds at the top of a plant.

13b
Sme Calculator
7 marks

Photosynthesis produces glucose, which is then transported and stored in plants.

Outline how this glucose is transported and stored.

Did this page help you?

1a
Sme Calculator
2 marks

Based on your knowledge of diffusion, explain why multicellular organisms need a specialised transport system.

1b
Sme Calculator
2 marks

The following table shows the volume of blood present in the left ventricle of a person at different times over the course of one second.

Time / s Volume of blood in left ventricle / cm3
0.0 105
0.1 117
0.2 89
0.3 63
0.4 45
0.5 55
0.6 87
0.7 105
0.8 119
0.9 90
1.0 62

Use the information in the table to calculate the heart rate (beats min-1) of this person. Show your working.

1c
Sme Calculator
2 marks

During ventricular systole, the muscular wall of the ventricles contract.

(i)

Based on the information provided in the table in part a), determine during which time interval(s) the heart was in ventricular systole.

[1]

(ii)

Explain your answer in part i).

[1]

Did this page help you?

2a
Sme Calculator
2 marks

Ebstein's anomaly is a birth defect where the tricuspid valve is displaced from its normal position between the right atrium and ventricle. This defect will often cause the valve to not function properly. Babies born with Ebstein's anomaly will require surgery to correct the defect.

The following diagram compares the structure of a normal heart with the heart of a person born with Ebstein's anomaly.h-3a-1

Explain the effect that a faulty heart valve may have on the flow of blood through the right side of the heart.

2b
Sme Calculator
2 marks

Babies born with Ebstein's anomaly will often develop an enlarged heart and swollen limbs once they reach adulthood.

Based on the information provided in part a), suggest a reason for each of these symptoms.

2c
Sme Calculator
2 marks

Tricuspid valve surgery is a very effective way to treat patients born with Ebstein's anomaly and restore heart function back to normal. One way to measure the effectiveness of this treatment is to investigate the increase in cardiac output before and after surgery.

Cardiac output is the amount of blood that the heart pumps per minute.

A patient born with Ebstein's anomaly has a mean heart rate of 78 beats per minute and with every heart beat, 45 cm3 of blood leaves the heart.

Calculate the cardiac output (dm3min-1) of this patient. Show your working.

2d
Sme Calculator
1 mark

After the surgery, the cardiac output of the patient from part c) increased by 25%.

Calculate the cardiac output (dm3min-1) after surgery.

Did this page help you?

3a
Sme Calculator
2 marks

Carnitine is a chemical that plays an essential role in energy metabolism by transporting long-chain fatty acids into mitochondria in cells where they are then oxidised. It is often used as a supplement by athletes to enhance their athletic performance and to aid in weight loss.

Recent studies have linked the prolonged use of carnitine supplements with increased levels of trimethylamine N-oxide (TMAO) in the bloodstream. TMAOs can trigger inflammatory and immune responses in the body, as well as elevated blood glucose levels.

Based on the information provided, explain why increased TMAO levels could increase the risk of suffering a heart attack.

3b
Sme Calculator
1 mark

Scientists investigated the effect of carnitine in the diet on the plasma concentration of TMAO in mice. Four groups, consisting of ten mice each, were fed one of four possible diets.

  • Diet 1 - a normal mouse diet with natural carnitine levels 
  • Diet 2 - a normal mouse diet with added carnitine
  • Diet 3 - a low carnitine mouse diet
  • Diet 4 - a normal mouse diet with added carnitine and antibiotics

The TMAO levels in the bloodstream of the mice were measured over time and a mean for each group was calculated.

Suggest a possible hypothesis for this investigation.

3c
Sme Calculator
1 mark

The results of the investigation described at part b) are shown in the following graph.

RkEvF74L_h-4c

Explain the results from the group that followed diet 4.

3d
Sme Calculator
3 marks

The scientists concluded that a diet high in carnitine will increase levels of TMAO in the bloodstream in humans.

Evaluate this conclusion.

Did this page help you?

4a
Sme Calculator
3 marks

The sinoatrial node (SAN) is considered to be the pacemaker of the heart.

Explain this statement.

4b
Sme Calculator
7 marks

Outline the pressure changes that occur during one cardiac cycle and the effect this has on the valves in the heart.

Did this page help you?

5a
Sme Calculator
4 marks

The effect of humidity on the transpiration stream within the xylem of an oak tree was investigated, the results are displayed in the graphs below.

7vWwP4N8_humidity-and-cohesion-tension-sq

Describe how the trends shown in graph A compare with the trends shown in graph B.

5b
Sme Calculator
4 marks

Outline how the changes in humidity lead to the changes in water tension measured in the xylem at the top of the tree.

5c
Sme Calculator
4 marks

During the investigation, the scientist also measured the diameter of the tree trunk, the results can be seen in the table below:

Time Circumference of the trunk (cm)
7:00 97.5
9:00 97.4
11:00 96.5
13:00 95.7
15:00 95.7
17:00 96.3
19:00 97.3
21:00 97.4
23:00 97.5

Explain how this data and the data in the graphs from part a) support the cohesion-tension theory.

5d
Sme Calculator
5 marks

The scientist who carried out the investigation in part a) concluded from his data that water moves through the xylem through the cohesion tension mechanism.

Evaluate his conclusion based on the validity of the evidence provided by the results of this investigation.

Did this page help you?

6
Sme Calculator
4 marks

Describe the pressure changes which occur in the xylem as a result of water moving through the transpiration stream.

Did this page help you?

7a
Sme Calculator
1 mark

A scientist is investigating two substances, X and Y, which may affect the growth of new roots from a cut plant stem. They used a ringing experiment to investigate the transport of substances X and Y through the stems taken from a grapefruit plant. A length of the stem was cut from each grapefruit plant and a small block of agar was placed at the top of each stem. Substance X or Y was added to some of the agar blocks. 

agar

The stems were grown in the same environmental conditions for 5 weeks and then the number of roots per stem was recorded. The roots grew at the opposite end to where the agar block was located. The table shows the results of the experiment. 

Treatment Mean number of roots per stem
1 6
2 13
3 6
4 2
5 6

Agar delivers substances X and Y in treatments 2 - 5. Suggest one other reason why agar is present in all of the treatments. 

7b
Sme Calculator
2 marks

Suggest a conclusion that can be drawn about the action of substance Y, using the information from the diagram at part a).

7c
Sme Calculator
4 marks

The movement of substances through the phloem can be explained using the mass flow hypothesis. The mass flow hypothesis states that phloem sap moves through sieve tubes down a hydrostatic pressure gradient.

Evaluate whether the data from this experiment supports the mass flow hypothesis. Note that no statistical analysis is required.

7d
Sme Calculator
3 marks

Upon further research, it was discovered that substance Y could be sprayed onto the leaves of a plant and it would be absorbed into the phloem sap.

Using this information, outline the mechanism by which substance Y could act as weed control.

7e
Sme Calculator
2 marks

Suggest, with a reason, a better measure of the dependent variable in the investigation in part a) of this question. 

Did this page help you?

8a
Sme Calculator
6 marks

Translocation in the phloem can be regarded as the plant equivalent of the mammalian circulatory system. 

Evaluate this statement. 

8b
Sme Calculator
2 marks

Two parameters of the contents of the phloem have an influence on the rate of translocation within that phloem. These are collectively called water potential and given the symbol Ψ.

There are two types of water potential, each given the symbols Ψp and Ψs.

Suggest what each symbol relates to.

8c
Sme Calculator
2 marks

Sugar beet (Beta vulgaris subsp vulgaris) is the second most important crop grown for table sugar (behind sugar cane), accounting for around 30% of worldwide production. The roots are harvested and processed for their high sugar content. 

Yields of sugar beet can be affected by Beet Jaundice Virus, which is spread by aphids and turn crops yellow (see image below). The mouthparts of aphids are adapted to pierce the phloem sieve tubes in plant organs.

Sugar beet jaundice virus - SQ

Suggest how Beet Jaundice Virus decreases yields for commercial beet farmers.

Did this page help you?

9a
Sme Calculator
4 marks

The following statements summarise the results from experiments designed to discover more about the translocation of organic materials in the phloem.

A Any increase in the sugar content of leaves is followed by a similar change in the sieve tube contents in the stem
B The rate of transport increases with increasing temperature, reaching a maximum at 25°C before decreasing at higher temperatures
C Translocation stops when stems are treated with a substance that inhibits respiration
D Sugars can be transported both up and down the plant
E Aphids can be used to sample phloem sap
F Roots, young leaves and growing fruits will import sugars


State all the letters that provide evidence for the following conclusions. 

(i)
Translocation is an active process.

[2]

(ii)
Sugars are translocated from source to sink. 

[2]

9b
Sme Calculator
3 marks

Explain how mass flow of the phloem sap occurs in plants with a vascular system. 

9c
Sme Calculator
2 marks

The use of aphid stylets to measure translocation is well documented. This exploits the aphid's behaviour of penetrating the plant stem with its stylet in order to extract sugars and nutrients from the phloem. 

Scientists observing this behaviour were initially puzzled by the fact that an aphid appears to excrete a large proportion of the sugar it ingests via its stylet; it clearly ingests a lot more sucrose than it needs for its own metabolism.

Suggest one explanation for this behaviour. 

9d
Sme Calculator
2 marks

Phloem sieve plates have an adaptation whereby a sieve plate closes when the phloem is damaged mechanically eg. by a chewing animal. A polysaccharide called callose builds up in sieve plate pores and can seal the pores within as little as 20 minutes. 

Suggest a reason for this adaptation.

Did this page help you?

10a
Sme Calculator
1 mark

Translocation is the movement of the products of photosynthesis within a plant. 

Translocation occurs in the phloem and involves sources and sinks.

Using the outline below, draw the position of the phloem in the root of a dicotyledonous plant. 

white-circle---sq

10b
Sme Calculator
2 marks

Research using carbon dioxide containing a radioactive label, 14C, has revealed the following evidence about the mechanism of translocation:

A. Radio-labelled carbon can be observed in the phloem soon after being supplied to a well-lit plant

B. The rate of movement of sugars in the phloem is many times faster than could be achieved by diffusion alone

Other research has revealed that:

C. An insect such as an aphid feeds by inserting its stylet (mouth parts) into the phloem

D. The pH of the phloem companion cells is lower than surrounding cells

E. The phloem companion cells contain many mitochondria

Using the letters A, B, C, D and E, select two pieces of evidence from the list above which support the theory that translocation occurs in the phloem.

10c
Sme Calculator
4 marks

The image below shows a potato plant. Potatoes grow tubers, which are underground storage organs. 
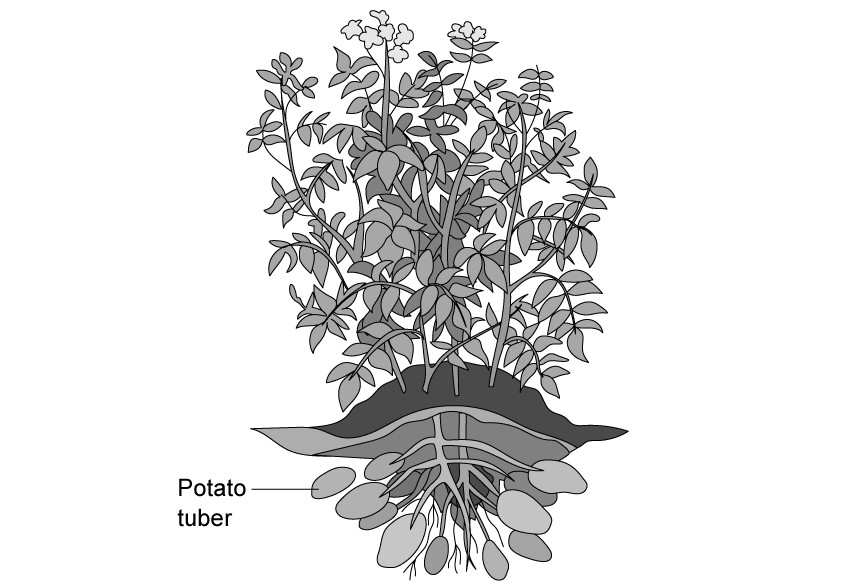
Potato plant with tuber - SQ

Actively growing tissues have a high demand for carbohydrates. This means that a lot of phloem sap is directed to these tissues and requires sucrose to be unloaded in large amounts.

In an investigation, potato plants were modified by having a gene for invertase inserted into their DNA so that the gene would be expressed in the tubers. Invertase is responsible for catalysing the hydrolysis of the disaccharide sucrose.

A trial experiment was carried out to compare the properties of the modified plants with those that had not been modified. After harvesting, the tubers of three of each type of plant were compared. The results are shown in the table below. 

  Modified Not modified
Mean number of tubers per plant 2.2 5.3
Mean mass per tuber / g 49.7 16.8

Mean sucrose concentration / mg g-1 of tuber mass

1.4 13.7

Mean glucose concentration / mg g-1 of tuber mass

36.3 ± 3.5 1.9 ± 0.3
Invertase activity / arbitrary units 62 1

In the modified plants, the unloading of sucrose is increased in the tubers compared to those that were not modified.

The transport of sucrose to the tubers was also increased in the modified plants.

Using the data and the information given, deduce a possible mechanism to account for the increased unloading and transport of sucrose in the modified plants.

Did this page help you?

11
Sme Calculator
2 marks

The microscope image below shows a cross section of part of a stem of a herbaceous (non-woody) plant.

Vascular bundle xylem phloem cambium stem micrograph

Image courtesy of Berkshire Community College Bioscience Image Library. Adapted and redistributed under a Creative Commons CC0 1.0 Universal Public Domain Dedication license under conditions found at https://creativecommons.org/publicdomain/zero/1.0/deed.en 

Identify tissue types X and Y in the image.

Did this page help you?