Water use

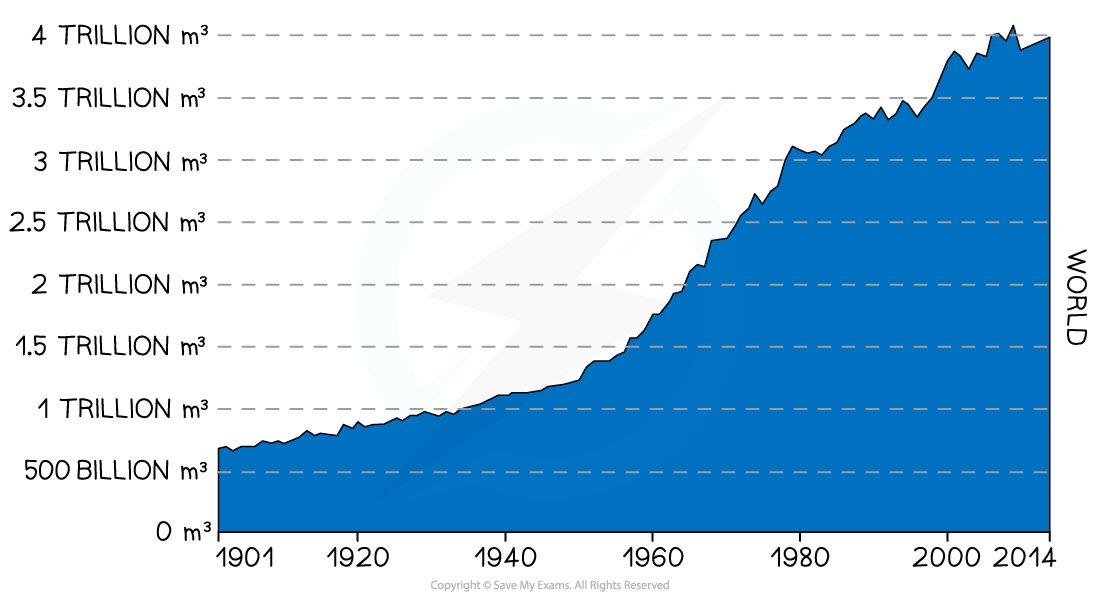
Graph to show increased demand for water
- The world’s population has tripled since 1922
- This has increased the global demand for water

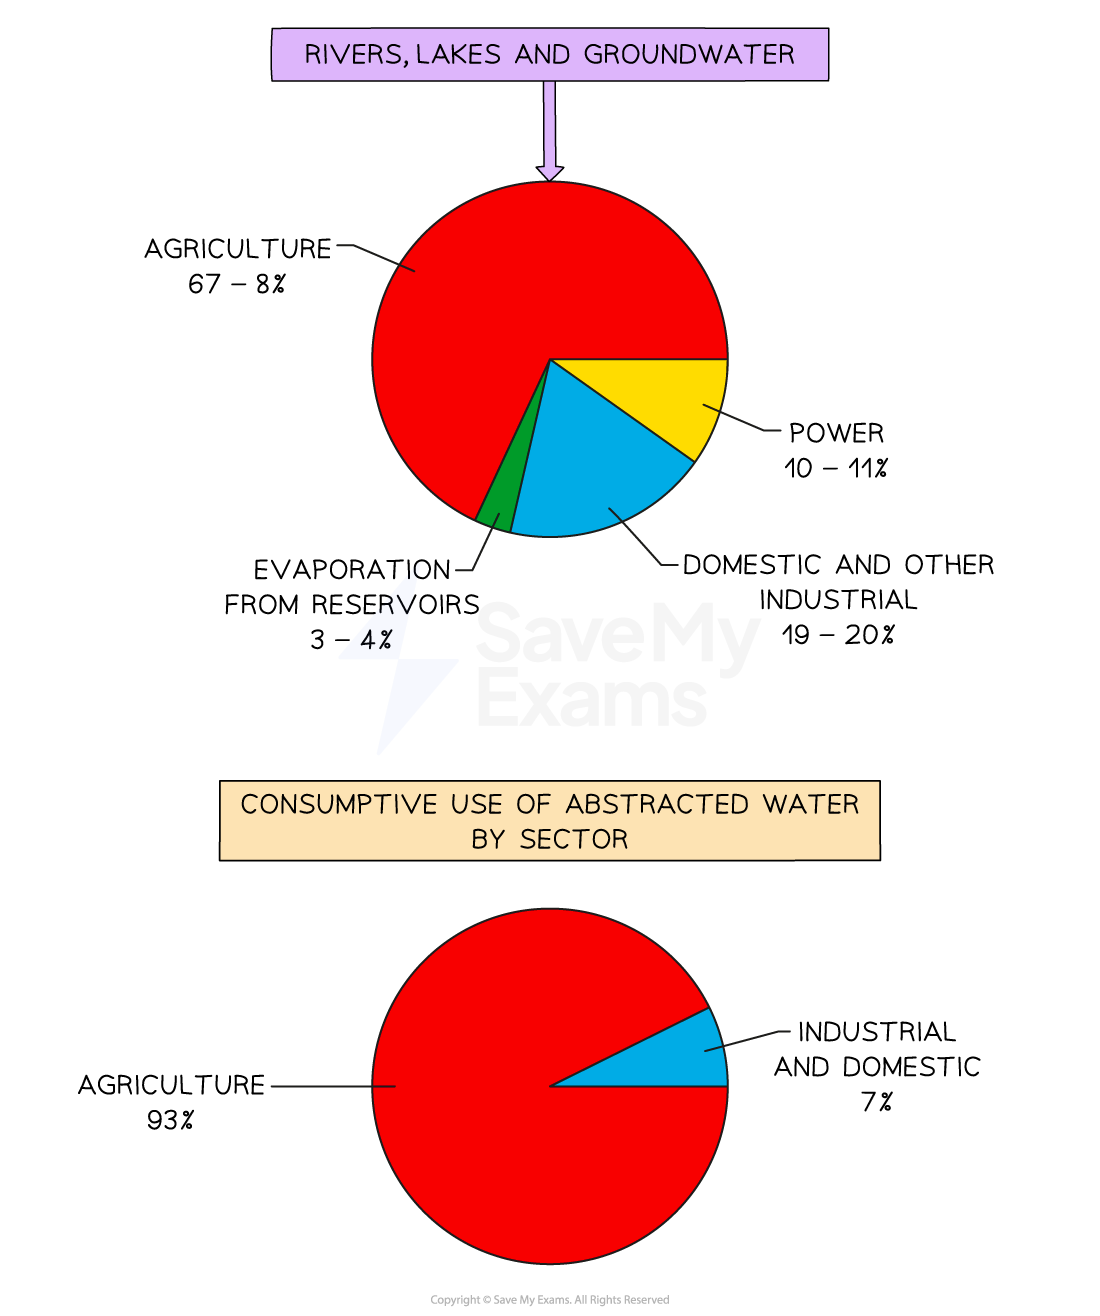
Water use by sector
- Globally, agriculture is the largest user of water
- Disputes over water scarcity may lead to more armed conflicts
- The World Health Organisation claim that 3.6 billion people do not have access to safely managed sanitation in their home
- Rural areas are the worst affected, 8 out of 10 people who continue to lack access to safe drinking water
Water quality
- In 2022, at least 1.7 billion people in the world drank water that had been contaminated with faeces
- Microbiologically contaminated water can transmit diseases such as cholera
- One million people are estimated to die each year from diarrhoea due to unsafe drinking water, sanitation and hand hygiene
- Water quality may be affected by:
- Use of fertilisers and pesticides from agriculture
- Sewage water
- Industrial processes
- Access to safe water may be limited by availability, infrastructure and cost
- Urban areas have better access to clean water than rural areas
- The cost of water when connected to water mains is less expensive than when customers have to pay
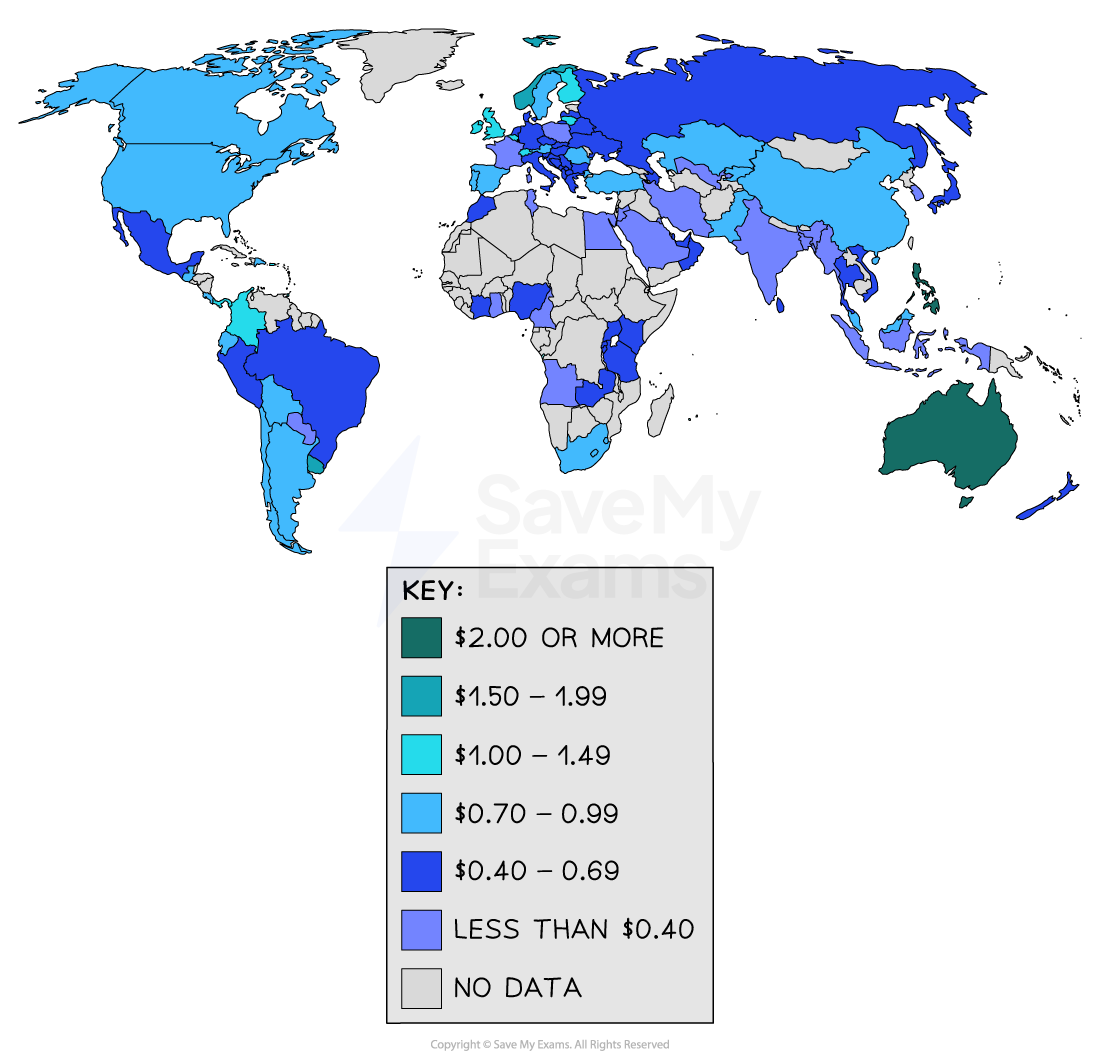
Cost of bottled water

Cost of bottled water


