
Identifying Recombinants in Crosses
- Genetic diagrams involving autosomal linkage often predict solely parental type offspring (offspring that have the same combination of characteristics as their parents)
- However in reality recombinant offspring (offspring that have a different combination of characteristics to their parents) are often produced
- This is due to the crossing over that occurs during meiosis
- The crossing over and exchanging of genetic material breaks the linkage between the genes and recombines the characteristics of the parents

The process of crossing-over results in recombinant phenotypes that can differ from the parental phenotype.
- The frequency of recombinants within a population will nearly always be less than that of non-recombinants
- Crossing over is random and chiasmata form at different locations with each meiotic division
- Recombination frequency between two linked genes is greater when genes are further apart on the same chromosome
- There are more possible locations for a chiasma to form between the genes
Identifying recombinants using test crosses
- Test crosses are often used to determine unknown genotypes
- Similarly, they can be used to identify recombinant phenotypes in offspring
- An individual is crossed with a homozygous recessive individual (for both traits)
- If any of the offspring possess a non-parental phenotype then they are labelled as recombinants
- These individuals have new allele combinations due to the process of crossing over during meiosis leading to the exchange of genetic material between chromosomes
- If any of the offspring possess a non-parental phenotype then they are labelled as recombinants
Drawing a Punnett square to show dihybrid inheritance of linked genes
- A number of sweet pea plants were generated by crossing double-homozygous dominant plants (PL)(PL) with double-homozygous recessive plants (pl)(pl) to produce a 100% heterozygous F1 generation (PL)(pl) as expected
- Members of this generation were then interbred to produce the F2 generation
- Alleles:
- P = purple flowers, dominant to p = red flowers
- L = long seeds, dominant to l = round seeds
Possible Gametes Table

F2 Punnet Square Showing Possible Genotypes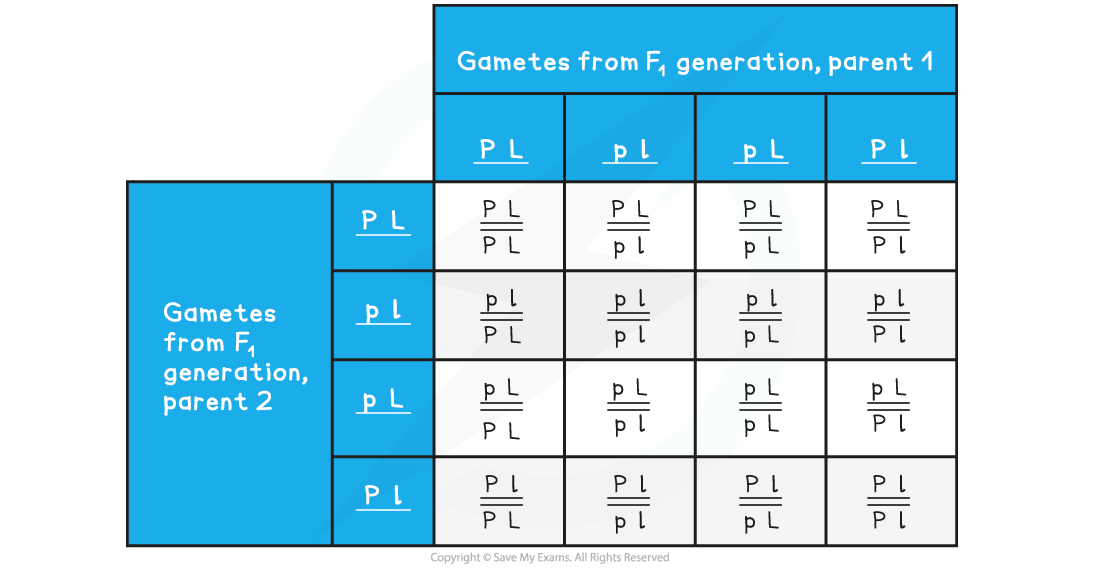

- According to Mendelian ratios and the Punnett square, the F2 generation should follow the typical 9:3:3:1 ratio
- However, in reality, the frequency of recombinant gametes will be much lower than that of parental gametes
- This affects the resulting offspring phenotypes, with fewer recombinant phenotypes occurring than expected
Expected vs Predicted Phenotypes Table

Observations
- More of the F2 offspring than expected showed the parental phenotypes
- Fewer plants with recombinant phenotypes were produced than the 9:3:3:1 ratio would suggest
- The actual ratios found were referred to as 'non-Mendelian' as they didn't follow Mendel’s pattern
- However, this was not zero; some recombinants were still being produced
Possible Theories to Explain These Findings
- At the time, it was known that many genes were carried on a few chromosomes
- The idea that certain genes share the same chromosome was being developed by many scientists
- This suggested that genes could be inherited together, not by the law of independent assortment as put forward by Mendel
- The idea of linkage of genes was developed to explain the non-Mendelian ratios
- The frequency of recombinant phenotypes is lower because crossing over is a random process and the chiasmata do not always form in the same place for each meiotic division
- The frequency of recombinant gametes also depends on the closeness of linkage between the two genes
- Genes located close together on a chromosome are less likely to be separated by crossing over
- So recombinants of those two genes will be less frequent
- Thomas Hunt Morgan later provided proof of linkage to explain non-Mendelian ratios in his experimentation with fruit flies (Drosophila melanogaster)
Exam Tip
Remember to distinguish between sex linkage and autosomal linkage. The explanation of non-Mendelian ratios falls into the domain of autosomal linkage for IB.